文章目录
显示
Python微信订餐小程序课程视频
https://blog.csdn.net/m0_56069948/article/details/122285951
Python实战量化交易理财系统
https://blog.csdn.net/m0_56069948/article/details/122285941
先来个效果图
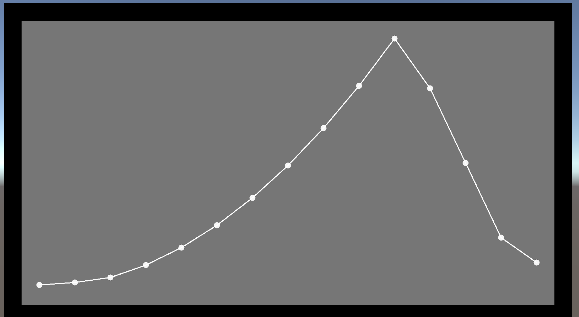
觉得不好看可以自己调整
1.绘制数据点
线状图一般由数据点和连线组成
在绘制连线之前,我们先标出数据点
这里我选择用Image图片来绘制数据点
新建Canvas,添加空物体Graph
在Graph上添加空物体 GraphContainer 和 Image BackGround
在 GraphContainer 上添加 Image BackGround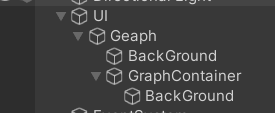
修改两个BackGround的大小和颜色制作背景
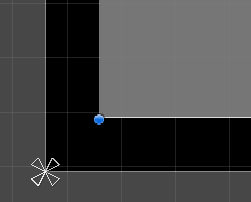
注意:这里GraphContainer 锚点为左下角
左下角默认为原点(0,0),之后所有的图形绘制都会在GraphContainer之内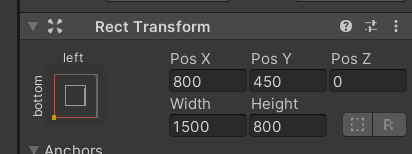
在Graph上新建脚本MyGraph
public class MyGraph : MonoBehaviour
{
    [SerializeField]
    private Sprite circleSprite;    //需要画的图像,这里赋值为了一个Unity自带的圆形,也可改为其它图形

    private RectTransform graphContainer;   //声明一个 RectTransform,用于修改图片的大小

    private void Awake()
    {
        //获取graphContainer的RectTransform并赋值,为内侧的小矩形,会作为我们的画板
        graphContainer = transform.Find("GraphContainer").GetComponent();
 CreateCircle(new Vector2(200, 200)); //在(200,200)的地方创建圆,用于测试
 }

 private void CreateCircle(Vector2 anchoredPosition)
 {
 GameObject gameObject = new GameObject("circle", typeof(Image)); //生成新物体,该物体包含一个图片组件
 gameObject.transform.SetParent(graphContainer, false); //将图片设为graphContainer的子物体
 gameObject.GetComponent().sprite = circleSprite; //将图片赋值为Inspector中设置的图片

 //获取新建图片物体的RectTransform并赋值
 RectTransform rectTransform = gameObject.GetComponent();
 rectTransform.anchoredPosition = anchoredPosition; //设置图片位置
 rectTransform.sizeDelta = new Vector2(20, 20); //设置图片大小,可设为公共变量来修改

 //下面两句将生成图片的锚点设为了父物体左下角(原点)
 rectTransform.anchorMin = new Vector2(0, 0);
 rectTransform.anchorMax = new Vector2(0, 0);
 }
}
运行后便会出现一个点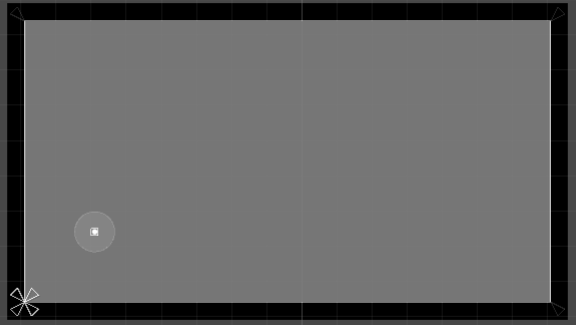
2.根据List列表输入绘制出多个圆点
继续修改MyGraph
  public class MyGraph : MonoBehaviour
{
    //[SerializeField]
    //private Sprite circleSprite;

    //private RectTransform graphContainer;
    private void Awake()
    {
        //graphContainer = transform.Find("GraphContainer").GetComponent();
        //声明一个列表用于测试
        List<int> valueList = new List<int>() { 1, 2, 4, 9, 16, 25, 36, 49, 64, 81, 100, 80, 50, 20, 10 };
        ShowGraph(valueList);
    }

    private void CreateCircle(Vector2 anchoredPosition)
    {
        ......
    }

    private void ShowGraph(List<int> valueList)
    {
        int maxValue = 0;
        foreach (int value in valueList)    //找出列表中的最大值
        {
            if (maxValue <= value)
            {
                maxValue = value;
            }
        }

        float graphWidth = graphContainer.sizeDelta.x;      //获取画布graphContainer的宽度
        float graphHeight = graphContainer.sizeDelta.y;     //获取画布graphContainer的高度

        float xSpace = graphWidth / (valueList.Count - 1);  //数据点x坐标的间距
        float ySpace = graphHeight / maxValue;          //数据的y坐标的比例

        for (int i = 0; i < valueList.Count; i++)
        {
            float xPos = i * xSpace;                //x坐标为线性固定增长
            float yPos = ySpace * valueList[i];         //y坐标是以列表中最大值为画布高度,按值的大小与最大值的比例取高度
            CreateCircle(new Vector2(xPos, yPos));      //画出点
        }
    }
}
运行显示结果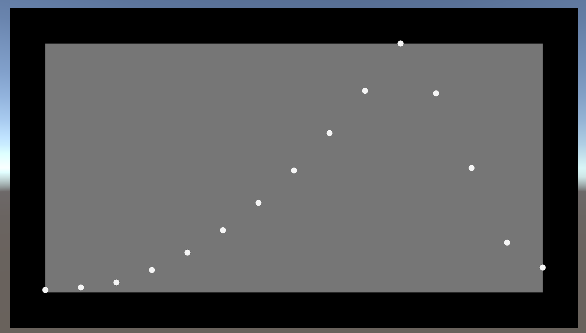
为了好看点,可以将内侧灰色的背景放大点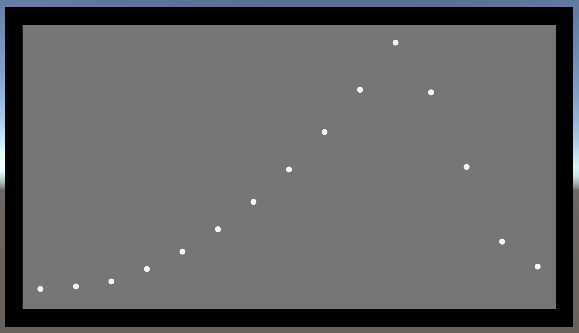
所有点都在 GraphContainer 之内,点在x坐标平均分布,最高点为列表中的最大值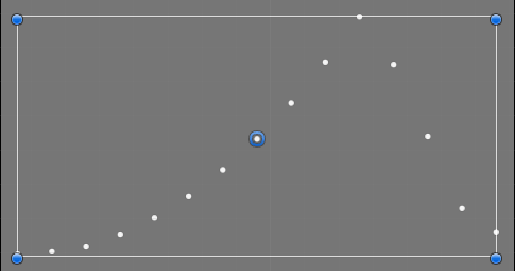
3.绘制点之间的连线
这里点之间的连线我仍然使用Image,只要Image足够细就能够看作线条
之后我会尝试能否使用LineRenderer
这里画线的想法是在两点中点创建一个线条状的Image,然后旋转一定角度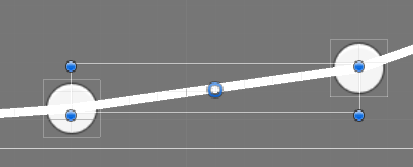
继续修改MyGraph
public class MyGraph : MonoBehaviour
{
    ......
    private void ShowGraph(List<int> valueList)
    {
        ......

        float xSpace = graphWidth / (valueList.Count - 1);
        float ySpace = graphHeight / maxValue;

        GameObject lastPoint = null;    //用于保存上一个点,画出上一个点到现在点的连线,这样就不用管最后一个点
        for (int i = 0; i < valueList.Count; i++)
        {
            //float xPos = i * xSpace;
            //float yPos = ySpace * valueList[i];

            GameObject circleGameobject = CreateCircle(new Vector2(xPos, yPos));//获取创建的点
            if (lastPoint != null)
            {
                //画线,参数为上一个点的位置,和当前点的位置
                DrawLine(lastPoint.GetComponent().anchoredPosition, circleGameobject.GetComponent().anchoredPosition);
 }
 lastPoint = circleGameobject; //画完连线之后,变为上一个点
 }
 }

 private void DrawLine(Vector2 pointA, Vector2 pointB) //画线方法
 {
 GameObject gameObject = new GameObject("line", typeof(Image));//新建一个物体包含一个Image组件
 gameObject.transform.SetParent(graphContainer, false); //将该图片设为graphContainer的子物体
 //就是在画板内画线
 RectTransform rectTransform = gameObject.GetComponent(); //获取 RectTransform 组件
 Vector2 dir = pointB - pointA; //两点间的向量

 //同样将线段锚点设为画板左下角(原点)
 rectTransform.anchorMin = new Vector2(0, 0);
 rectTransform.anchorMax = new Vector2(0, 0);
 rectTransform.sizeDelta = new Vector2(dir.magnitude, 3f); //线段的长宽,长为两点间向量的长度,就是两点间距离

 rectTransform.anchoredPosition = pointA + dir / 2; //线段的中心点,为两点间的中心点
 float angle = RotateAngle(dir.x, dir.y); //线段的旋转角度
 rectTransform.localEulerAngles = new Vector3(0, 0, angle); //旋转线段
 }
 private float RotateAngle(float x, float y) //旋转方法
 {
 float angle = Mathf.Atan2(y, x) * 180 / 3.14f;//Atan2返回的是弧度,需要乘以180/PI得到角度,这里PI直接用了3.14
 return angle;
 }
}
在RotateAngle()方法中Mathf.Atan2会返回角θ的弧度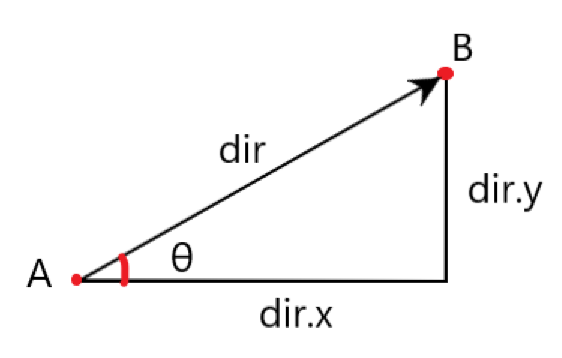
图片所示情况会返回正数,如果右边的点更矮则是负数,可以直接用于旋转
运行后显示效果: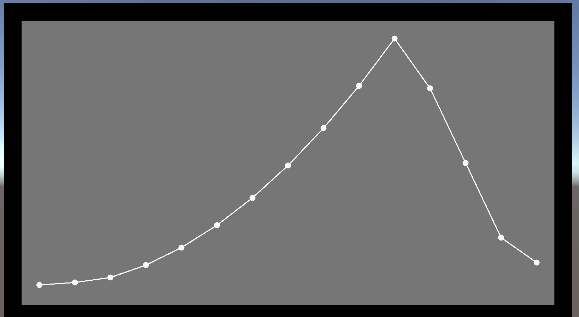
实际自己需要输入的数据列表建议自己进行修改
线状图2.0会加上坐标轴
转载请注明:xuhss » 在UnityUI中绘制线状统计图